
In the journey of every high-ticket investor, a Drawdown (a peak-to-trough decline in equity) is not a sign of failure, but a statistical certainty.
However, the math of recovery is asymmetrical. Losing 10% of your capital requires an 11.1% gain to recover, but losing 50% requires a 100% gain just to break even.
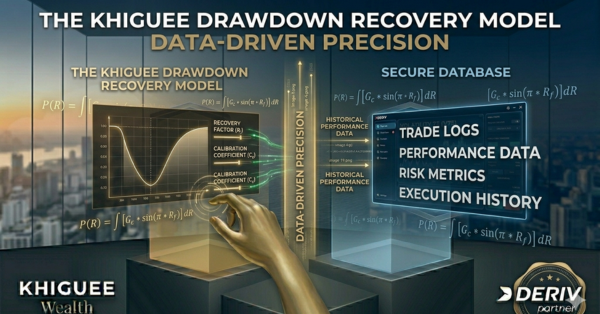
At Khiguee Wealth, we use Data-Driven Precision to ensure that drawdowns are kept within manageable limits and recovered through logic, not luck.
1. The Geometric Reality of Recovery
The deeper the hole, the harder it is to climb out. This is why our 1% Rule is non-negotiable.
- The Math: If you maintain a strict risk profile, a string of 5 losses results in a ~5% drawdown. Recovering this requires a manageable ~5.26% gain.
- The Khiguee Protocol: We avoid the “Martingale Trap”—the dangerous urge to double down after a loss. Instead, we rely on fixed-fractional position sizing to keep the recovery curve linear and stress-free.
2. Asymmetrical Risk-to-Reward (R:R) To recover efficiently, your winning trades must be larger than your losing trades.
- The Logic: By utilizing Smart Automation via the DBot-AR, we target a minimum R:R of 1:2 or 1:3.
- The Advantage: With a 1:3 ratio, you only need a 25% win rate to remain break-even. This mathematical cushion is what allows professional systems to endure volatility without emotional collapse.
3. Calibrating the Recovery Factor A professional trading system is evaluated by its Recovery Factor (Net Profit divided by Maximum Drawdown).
- Data-Driven Precision: We constantly analyze historical execution data to adjust our algorithmic triggers. If the market environment changes, our systems adapt to reduce exposure, preserving capital until the edge (advantage) returns.
Discipline Over Hope
Recovery is not about “hoping” for a big win. It is about the disciplined application of mathematics.
When you treat your portfolio like an engineering project, a drawdown becomes nothing more than a temporary data point in an otherwise ascending equity curve.
🛡️ Risk Disclosure:
Past performance is not indicative of future results. Drawdown recovery requires strict adherence to risk protocols. Content for educational purposes only.